Reading each report
This page explains what you see on each tab of the Reports page. All figures are in your organization’s base currency and come only from posted entries.
On the profit and loss and balance sheet, accounts are grouped under their parent accounts. Select the arrow beside a group to collapse or expand it.
Trial balance
Section titled “Trial balance”For each account: Code, Account, Opening Dr, Opening Cr, Debit, Credit, Closing Dr and Closing Cr, with Totals at the bottom. The Summary strip shows total debits, total credits and the Difference, which should be zero.
Include the year-end closing entry is ticked by default. Untick it to see the year’s balances before income and expenses were closed into equity.
Profit and loss
Section titled “Profit and loss”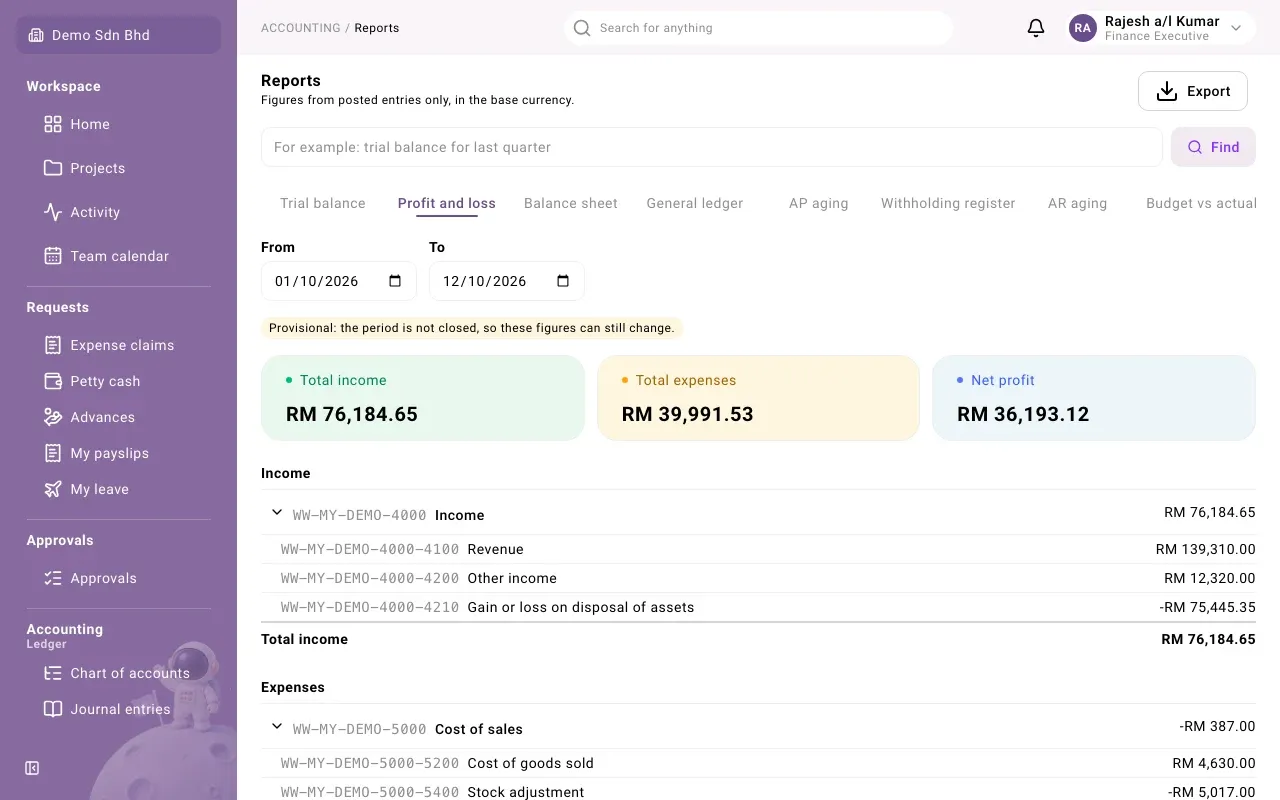
Income and Expenses, each listed by account with a total, then Net profit. A loss shows as a negative net profit. This report has no account filter.
Balance sheet
Section titled “Balance sheet”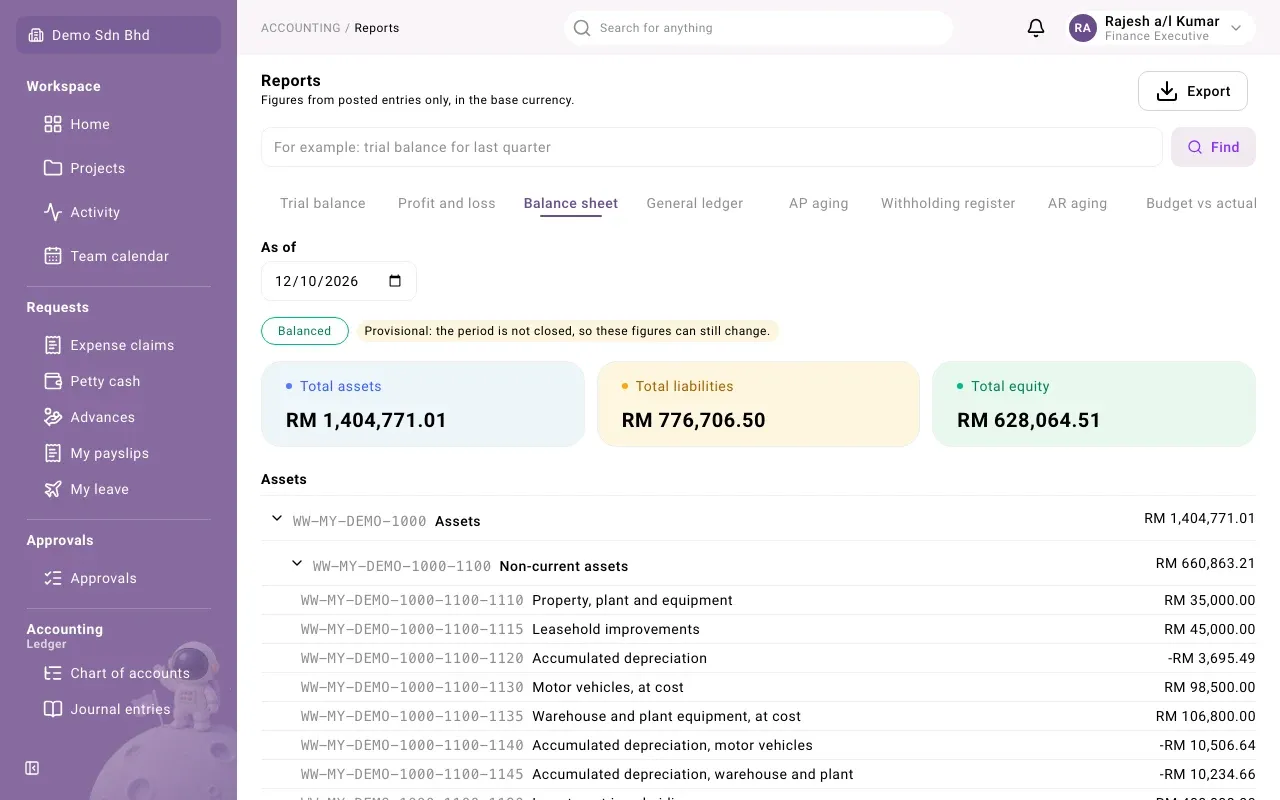
Assets, Liabilities and Equity on the As of date, with totals. Equity includes two lines the system works out for you:
- Current year earnings: this year’s profit or loss, not yet closed into equity
- Earlier years not yet closed: profit or loss from earlier years whose closing has not been posted
General ledger
Section titled “General ledger”For each account, an Opening balance, then every posted line with Date, Entry, Description, Debit, Credit and running Balance, ending with the Closing balance. Long ledgers load in parts; select Load more at the bottom to see the rest.
AP aging and AR aging
Section titled “AP aging and AR aging”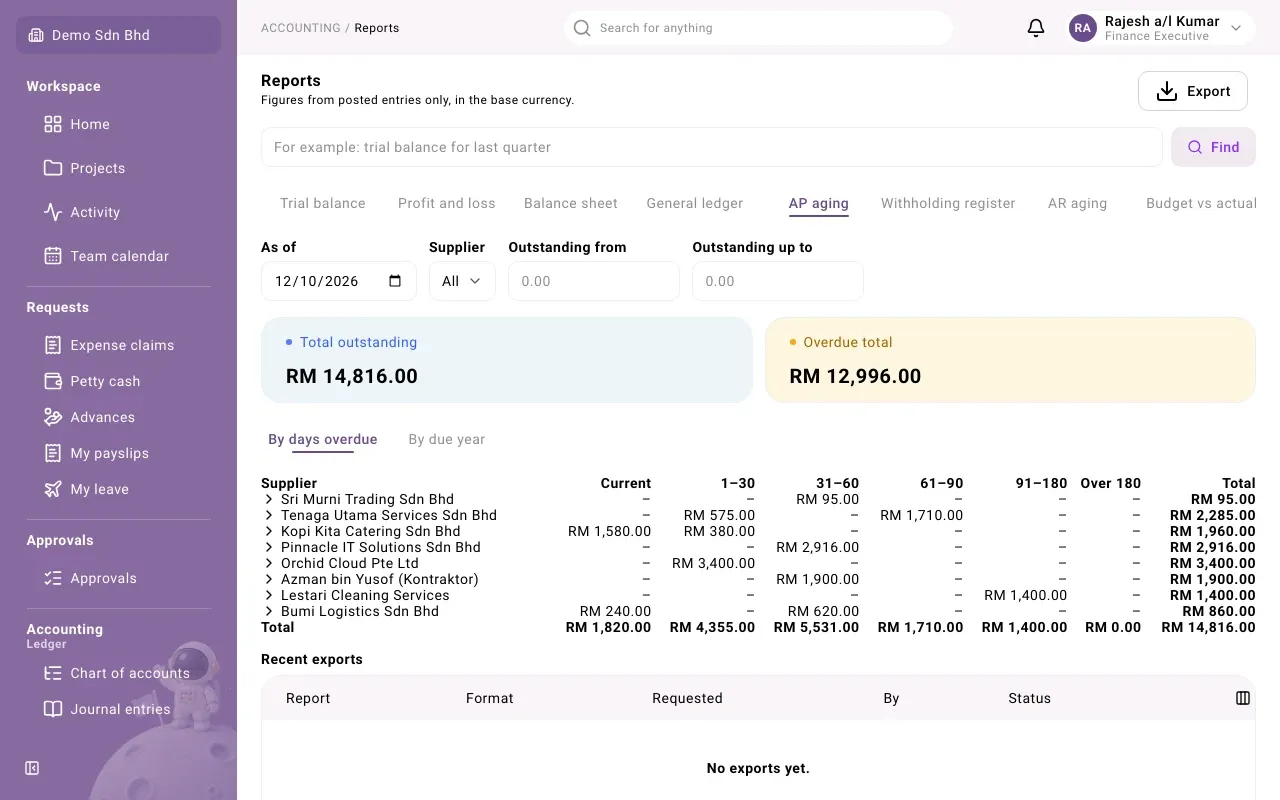
These show what is unpaid on the As of date.
- AP aging (what you owe) shows Total outstanding and Overdue total. Choose By days overdue for the columns Current, 1–30, 31–60, 61–90, 91–180 and Over 180, or By due year to group by the year each invoice falls due. In the days view, select a supplier’s name to list its documents, each with its due date and how many days overdue it is. Select a column heading to sort the suppliers by it.
- AR aging (what customers owe you) shows Total outstanding, Overdue and Over 90 days, with one row per customer and the columns Current, 1–30 days, 31–60 days, 61–90 days and Over 90 days.
If nothing is owed you see “Nothing is owed to suppliers as of this date.” or “No customer owes anything as of this date.” If your filters exclude everything you see “Nothing matches these filters.”
Withholding register
Section titled “Withholding register”Lists the withholding tax deducted from supplier payments in the period: Section, Supplier, Payment, Paid on, Taxable, Withheld, Status, Receipt and Flags, with totals per section.
| Status | Meaning |
|---|---|
| Open | Deducted, not yet paid over |
| In remittance | Included in a remittance that is in progress |
| Remitted | Paid over |
| Exempt (treaty) | Marked exempt under a tax treaty |
Two flags may appear: Late (increase may apply) and Invoice posted over a month before payment.
Budget vs actual
Section titled “Budget vs actual”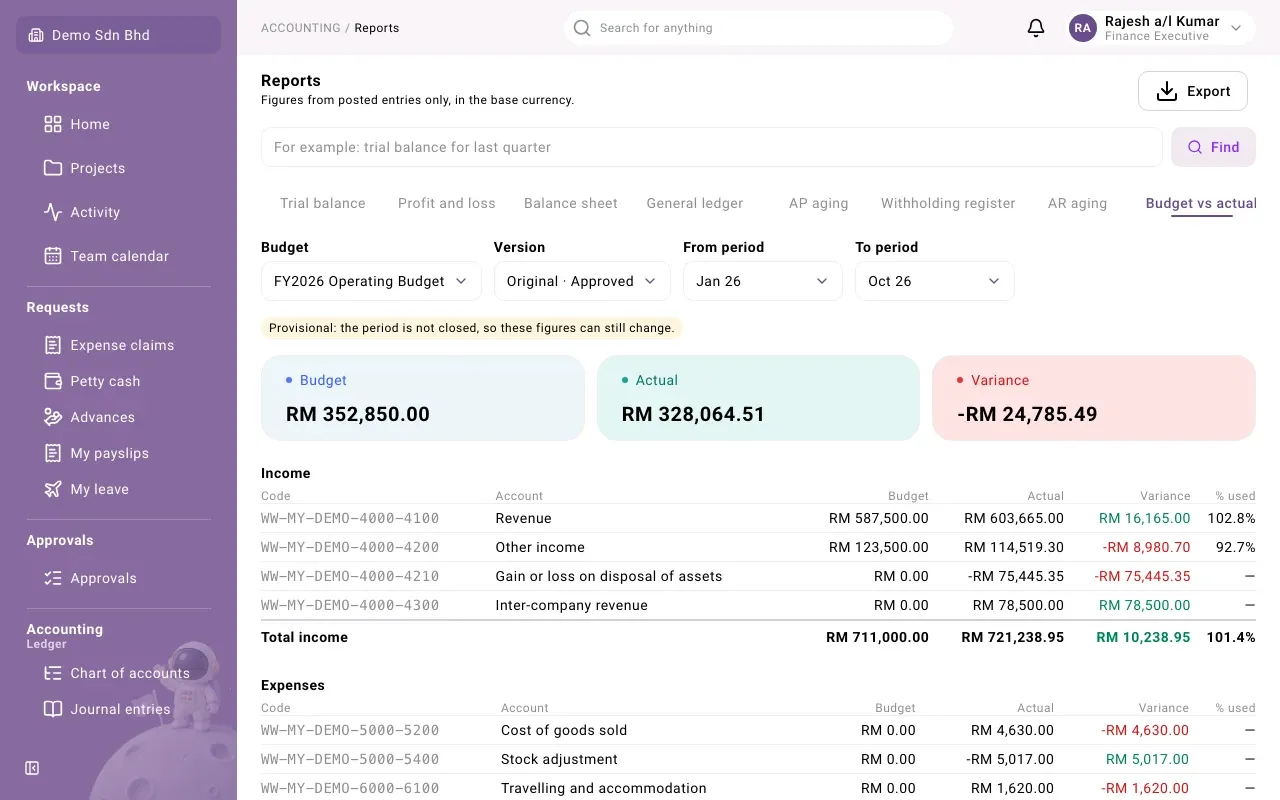
Choose a Budget, its Version and the From period and To period. Until a budget is chosen you see “Choose a budget to compare”. For each account it shows Budget, Actual, Variance and % used, under Income and Expenses, and the Net. A favourable variance is green, an unfavourable one red.
A version that is not approved is labelled “Draft budget — not yet approved”. When the budget is set per project or other analytic account, the report notes that spend not tagged to a budgeted one is not shown.
Invoice analysis
Section titled “Invoice analysis”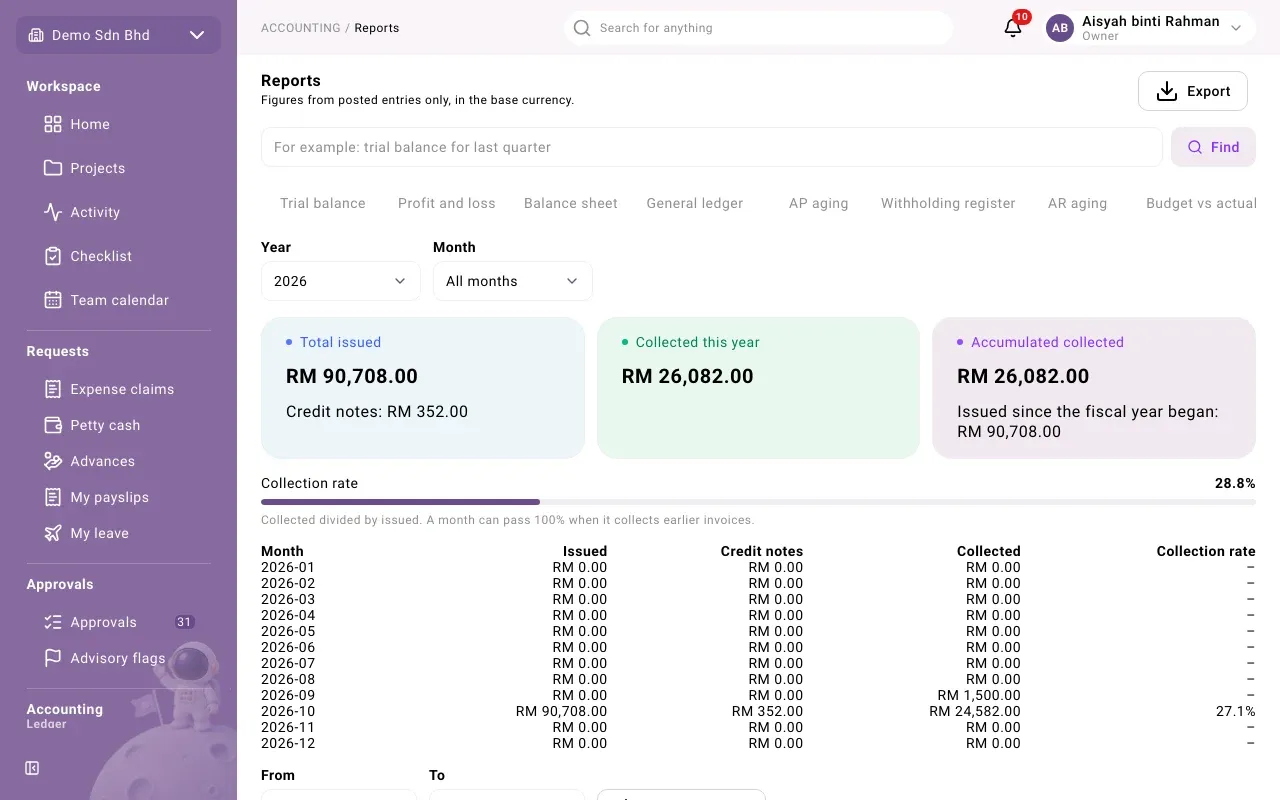
Shown only to people who may read the sales analysis. For the chosen Year (or All years) and Month it shows:
- Total issued, with Credit notes
- Collected this year or Collected this month
- Accumulated collected, with what was issued since the fiscal year began
- the Collection rate: “Collected divided by issued. A month can pass 100% when it collects earlier invoices.”
- a table by Month with Issued, Credit notes, Collected and Collection rate
If you may export, Export invoices below the table downloads the invoices themselves for the From and To dates you set there.