Fixed asset reports
Fixed assets → Asset reports has three tabs. Anyone with access to fixed assets can open them. They only read; nothing here posts.
Depreciation schedule
Section titled “Depreciation schedule”A forecast of each asset’s depreciation for the months ahead.
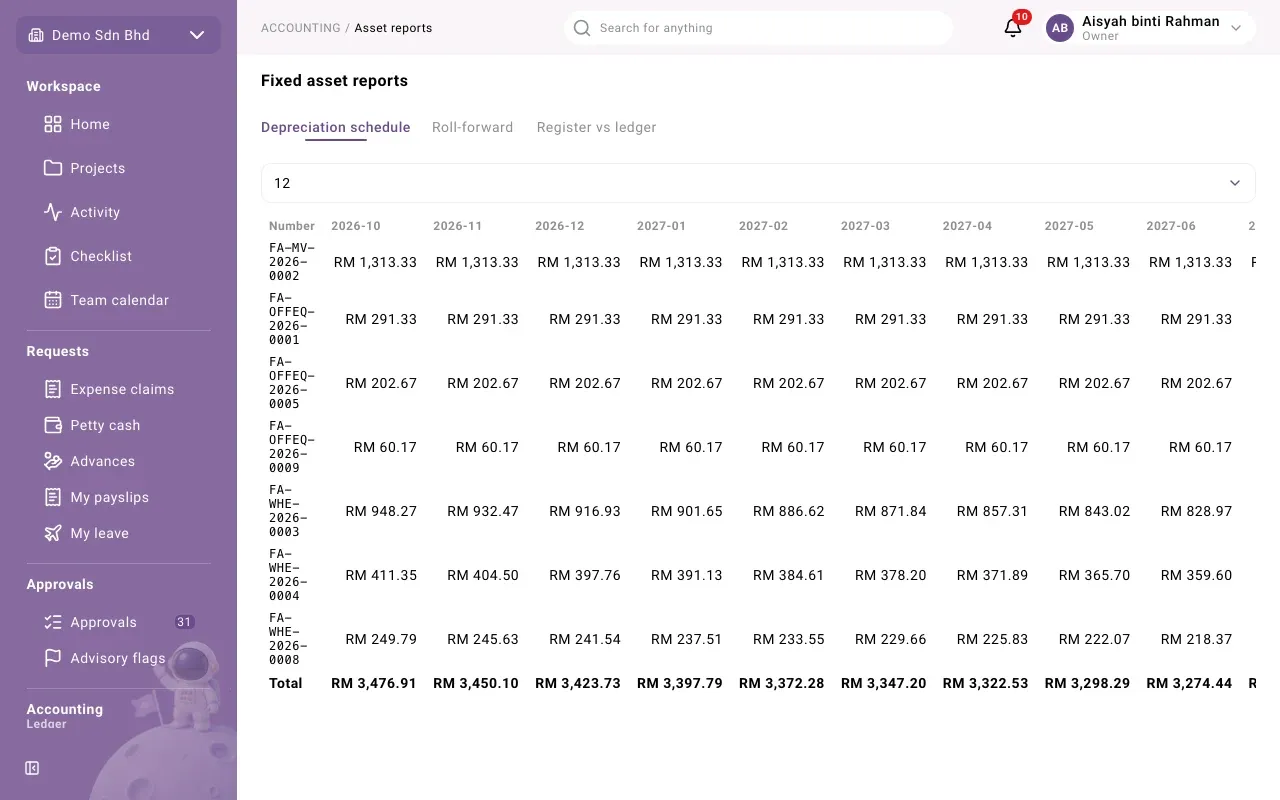
Choose how many Months to show: 12, 24, 36 or 60. Each row is an asset by number, with its charge in each month, and a Total row at the bottom. Use it to budget the depreciation expense.
Roll-forward
Section titled “Roll-forward”How cost and accumulated depreciation moved between two dates, class by class.
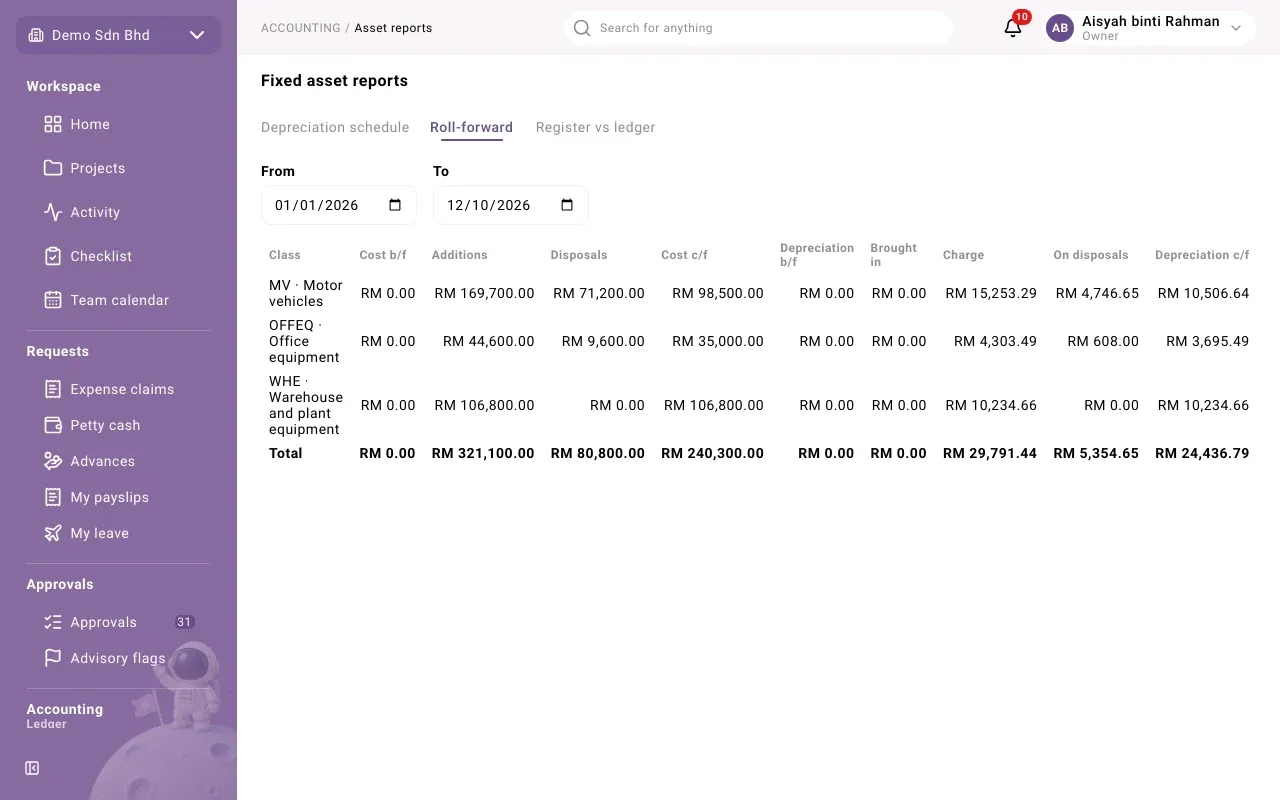
Pick From and To; it starts at the beginning of this year and ends today. The columns are:
| Column | What it shows |
|---|---|
| Cost b/f | Cost at the start |
| Additions | Cost added in the range |
| Disposals | Cost of assets disposed of in the range |
| Cost c/f | Cost at the end |
| Depreciation b/f | Accumulated depreciation at the start |
| Brought in | Accumulated depreciation that came in with assets added in the range |
| Charge | Depreciation charged in the range |
| On disposals | Accumulated depreciation cleared by disposals |
| Depreciation c/f | Accumulated depreciation at the end |
A Total row adds up every class. Your accountant can use this for the fixed asset note in the financial statements; they must confirm the figures.
Register vs ledger
Section titled “Register vs ledger”A check that the register agrees with the ledger.
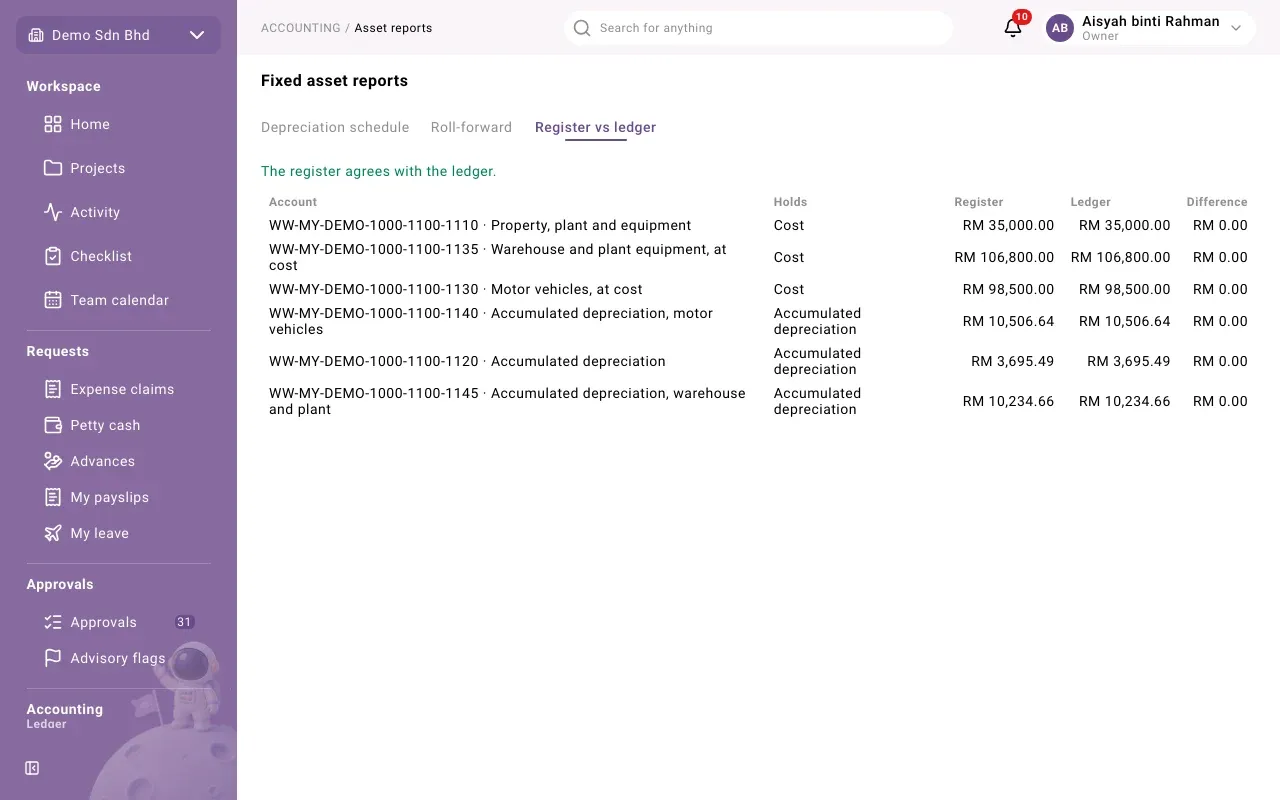
For each class account it shows the Account, what it Holds (Cost or Accumulated depreciation), the Register amount, the Ledger balance and the Difference.
- “The register agrees with the ledger.” means every difference is zero.
- “The register and the ledger differ. Register every posted cost, and check for reversed sources.” means something is out. The usual causes are a purchase posted to a class’s cost account but not yet registered, or a posted cost that was reversed after it was registered. Ask finance to look into it.